Market Outlook
September 21, 2017
Market Cues
Domestic Indices
Chg (%)
(Pts)
(Close)
Indian markets are likely to open in red tracking global indices and SGX Nifty.
BSE Sensex
(0.0)
(2)
32,401
US markets saw a considerable volatility late in the trading day as Fed left interest
Nifty
(0.1)
(6)
10,141
rates unchanged as widely expected but signaled another rate hike is likely this year.
Mid Cap
(0.1)
(12)
16,099
The Fed's projections pointed to a quarter basis point rate increase later in this year,
most likely at the December meeting. The major averages eventually ended the
Small Cap
(0.1)
(23)
16,871
session mixed, with the Dow and the S&P 500 rising to new record closing highs.
Bankex
(0.3)
(78)
28,134
While the Nasdaq edged down 0.1 % to 6,456, the Dow rose 0.2 % to 22,413 and
the S&P 500 inched up 0.1 % to 2,508.
Global Indices
Chg (%)
(Pts)
(Close)
The UK markets closed slightly lower on Wednesday as a brief surge in the pound
Dow Jones
0.2
42
22,413
yanked the benchmark FTSE 100 to session lows, but retail shares added to gains
Nasdaq
(0.1)
(5)
6,456
after monthly British retail sales leapt past expectations. The FTSE 100 index ended
FTSE
(0.1)
(3)
7,272
down 0.1% at 7,272 after swinging between gains and losses through the day.
Nikkei
0.1
11
20,310
Indian markets settled near the base line on Wednesday, mainly due to passive
Hang Seng
0.3
76
28,128
foreign investors, ahead of the Fed meeting outcome. Geo-political issues returned
Shanghai Com
0.3
9
3,366
after US President Donald Trump, threatened to “totally destroy” North Korea if it
persists with its ballistic missile and nuclear programme. The Sensex slipped into red,
before settling down 0.01%, at 32,401 while Nifty, after shuttling between 10,171
Advances / Declines
BSE
NSE
and 10,134, ended the day at 10,141, down 0.06%.
Advances
1,229
790
Declines
1,383
897
News Analysis
Unchanged
144
71
Bharat Road Network IPO listing review
Detailed analysis is on Pg2
Volumes (` Cr)
Investor’s Ready Reckoner
BSE#
5,069
Key Domestic & Global Indicators
NSE
29,143
Stock Watch: Latest investment recommendations on 150+ stocks
Refer Pg7 onwards
#Net Inflows (` Cr)
Net
Mtd
Ytd
FII
(79)
(2,423)
44,86
Top Picks
MFs
730
6,596
75,48
CMP
Target
Upside
Company
Sector
Rating
(`)
(`)
(%)
Blue Star
Capital Goods Accumulate
783
850
8.5
Top Gainers
Price (`)
Chg (%)
Dewan Housing FinanceFinancials
Accumulate
591
610
3.2
Divislab
943
9.1
Asian Granito
Others
Accumulate
504
570
13.2
Southbank
32
8.4
Navkar Corporation
Others
Buy
193
265
37.0
KEI Industries
Capital Goods
Accumulate
340
371
9.1
Jktyre
158
6.7
More Top Picks on Pg5
Fconsumer
65
6.6
Key Upcoming Events
Marksans
46
5.6
Previous
Consensus
Date
Region
Event Description
Reading
Expectations
Sep 21, 2017 Euro Zone Euro-Zone Consumer Confidence
(1.50)
(1.50)
Top Losers
Price (`)
Chg (%)
Sep 21, 2017 US
Initial Jobless claims
284.00
300.00
Redington
152
(4.3)
Sep 22, 2017 Germany PMI Services
53.50
53.70
Prestige
269
(4.1)
Sep 22, 2017 US
New home sales
571.00
600.00
Religare
43
(4.0)
Sep 26, 2017 Germany PMI Manufacturing
59.30
59.00
Naukri
1,092
(3.8)
More Events on Pg7
Trent
301
(3.6)
#as on 20th Sep, 2017
Market Outlook
September 21, 2017
News Analysis
Bharat Road Network IPO listing review
We had given a neutral rating on the Bharat Road Network Ltd (BRNL) IPO which
come with a price band of 195-205.
BRNL is present only in the BOT project segment and lack of presence in the EPC
segment makes it highly dependent on the traffic growth and price increase for
improving its profitability. Though BRNL’s projects are spread across India, the
past track record of the numbers doesn’t give enough confidence about sharp
improvement in the near term. The issue was priced at 2.6x its Pre Issue book
value and 1.5x -1.6x its diluted book value. Established players like IRB Infra with
their strong portfolios and superior track record are also trading at similar
valuations and hence, issue price left limited scope for further appreciation.
While the shares of BRNL listed around IPO price, yesterday it closed 11.7% down
to `181.
Economic and Political News
Arun Jaitley vows ‘necessary’ measures to revive slowdown-hit economy
Govt denies cut in fuel prices, to announce stimulus package for economy
soon
Fed keeps US rates steady, to start portfolio drawdown in October
Federal Reserve bullish on U.S. economic growth
CFO optimism for July-Sept at one-and- half year low
Corporate News
Hindalco, India’s top aluminum maker, will bypass bonds for loans any day
IUC cut: An aggressive Reliance Jio a big worry for Airtel, Idea
M&M to Acquire Turkey’s Erkunt for `478cr
Market Outlook
September 21, 2017
Top Picks
Market Cap
CMP
Target
Upside
Company
Rationale
(` Cr)
(`)
(`)
(%)
Strong growth in domestic business due to its leadership
in acute therapeutic segment. Alkem expects to launch
Alkem Laboratories
20,960
1,753
2,161
23.3
more products in USA, which bodes for its international
business.
We expect the company would report strong profitability
Asian Granito
1,515
504
570
13.2
owing to better product mix, higher B2C sales and
amalgamation synergy.
Favorable outlook for the AC industry to augur well for
Cooling products business which is out pacing the
Blue Star
7,502
783
850
8.5
market growth. EMPPAC division's profitability to
improve once operating environment turns around.
With a focus on the low and medium income (LMI)
consumer segment, the company has increased its
Dewan Housing Finance
18,523
591
610
3.2
presence in tier-II & III cities where the growth
opportunity is immense.
Loan growth is likely to pick up after a sluggish FY17.
Lower credit cost will help in strong bottom-line growth.
Karur Vysya Bank
9,612
159
180
13.2
Increasing share of CASA will help in NIM
improvement.
High order book execution in EPC segment, rising B2C
KEI Industries
2,645
340
371
9.1
sales and higher exports to boost the revenues and
profitability
Expected to benefit from the lower capex requirement
Music Broadcast
2,229
391
434
11.1
and 15 year long radio broadcast licensing.
Massive capacity expansion along with rail advantage
Navkar Corporation
2,759
193
265
37.0
at ICD as well CFS augurs well for the company
Strong brands and distribution network would boost
Siyaram Silk Mills
2,163
2,307
2,500
8.3
growth going ahead. Stock currently trades at an
inexpensive valuation.
Market leadership in Hindi news genre and no.
2
viewership ranking in English news genre, exit from the
TV Today Network
2,012
337
380
12.7
radio business, and anticipated growth in ad spends by
corporates to benefit the stock.
After GST, the company is expected to see higher
volumes along with improving product mix. The Gujarat
Maruti Suzuki
2,45,351
8,122
8,658
6.6
plant will also enable higher operating leverage which
will be margin accretive.
We expect loan book to grow at 24.3% over next two
GIC Housing
2,886
536
655
22.2
year; change in borrowing mix will help in NIM
improvement..
Source: Company, Angel Research
Market Outlook
September 21, 2017
Key Upcoming Events
Global economic events release calendar
Bloomberg Data
Date
Time
Country
Event Description
Unit
Period
Last Reported
Estimated
Sep 21, 2017
7:30 PMEuro Zone
Euro-Zone Consumer Confidence
Value
Sep A
(1.50)
(1.50)
6:00 PMUS
Initial Jobless claims
Thousands
Sep 16
284.00
300.00
Sep 22, 2017
1:00 PMGermany
PMI Services
Value
Sep P
53.50
53.70
7:30 PMUS
New home sales
Thousands
Aug
571.00
600.00
Sep 26, 2017
1:00 PMGermany
PMI Manufacturing
Value
Sep P
59.30
59.00
7:30 PMUS
Consumer Confidence
S.A./ 1985=100
Sep
122.90
119.25
Sep 28, 2017
6:00 PMUS
GDP Qoq (Annualised)
% Change
2Q T
3.00
3.20
Sep 29, 2017
1:25 PMGermany
Unemployment change (000's)
Thousands
Sep
(5.00)
2:00 PMUK
GDP (YoY)
% Change
2Q F
1.70
Sep 30, 2017
6:30 AMChina
PMI Manufacturing
Value
Sep
51.70
Oct 02, 2017
2:00 PMUK
PMI Manufacturing
Value
Sep
56.90
Oct 04, 2017
2:30 PMIndia
RBI Reverse Repo rate
%
Oct 4
5.75
2:30 PMIndia
RBI Repo rate
%
Oct 4
6.00
2:30 PMIndia
RBI Cash Reserve ratio
%
Oct 4
4.00
Oct 06, 2017
6:00 PMUS
Change in Nonfarm payrolls
Thousands
Sep
156.00
India
Imports YoY%
% Change
Sep
21.00
Oct 10, 2017
6:00 PMUS
Unnemployment rate
%
Sep
4.40
India
Exports YoY%
% Change
Sep
10.30
2:00 PMUK
Industrial Production (YoY)
% Change
Aug
0.40
Oct 12, 2017
US
Producer Price Index (mom)
% Change
Sep
0.50
5:30 PMIndia
Industrial Production YoY
% Change
Aug
1.20
Oct 13, 2017
6:00 PMUS
Consumer price index (mom)
% Change
Sep
0.40
China
Exports YoY%
% Change
Sep
5.50
Oct 16, 2017
12:00 PMIndia
Monthly Wholesale Prices YoY%
% Change
Sep
3.24
Source: Bloomberg, Angel Research
Market Outlook
September 21, 2017
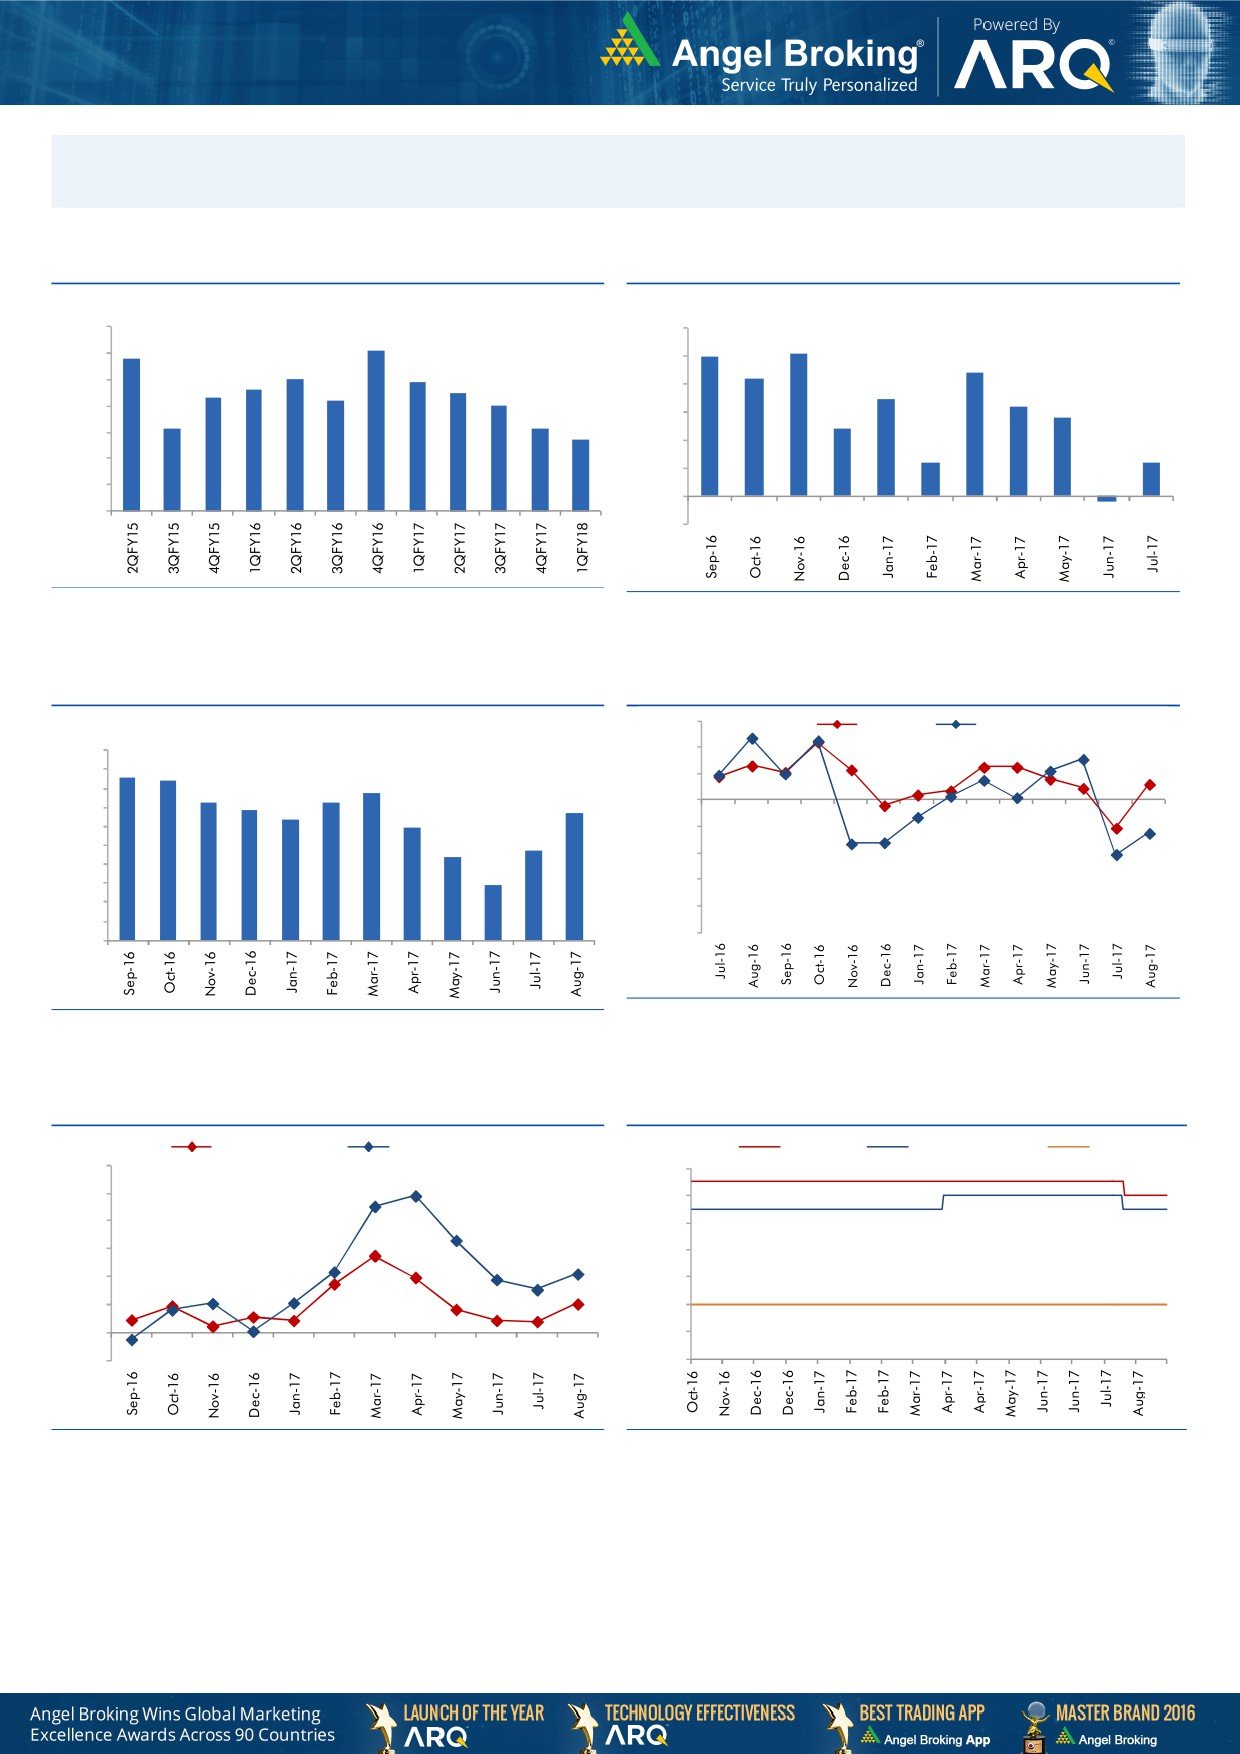
Macro watch
Exhibit 1: Quarterly GDP trends
Exhibit 2: IIP trends
(%)
(%)
10.0
6.0
9.1
5.1
8.8
5.0
9.0
5.0
4.4
8.0
7.9
4.2
7.6
7.5
8.0
7.3
3.5
7.2
7.0
4.0
3.2
2.8
7.0
6.1
6.1
3.0
2.4
5.7
6.0
2.0
1.2
1.2
5.0
1.0
4.0
-
3.0
(1.0)
(0.2)
Source: CSO, Angel Research
Source: MOSPI, Angel Research
Exhibit 3: Monthly CPI inflation trends
Exhibit 4: Manufacturing and services PMI
56.0
Mfg. PMI
Services PMI
(%)
5.0
54.0
4.3
4.2
4.5
3.9
52.0
4.0
3.6
3.7
3.4
3.4
3.2
50.0
3.5
3.0
3.0
48.0
2.4
2.2
2.5
46.0
2.0
1.5
1.5
44.0
1.0
42.0
0.5
40.0
-
Source: Market, Angel Research; Note: Level above 50 indicates expansion
Source: MOSPI, Angel Research
Exhibit 5: Exports and imports growth trends
Exhibit 6: Key policy rates
(%)
Exports yoy growth
Imports yoy growth
(%)
Repo rate
Reverse Repo rate
CRR
60.0
6.50
50.0
6.00
40.0
5.50
30.0
5.00
20.0
4.50
10.0
4.00
0.0
3.50
(10.0)
3.00
Source: Bloomberg, Angel Research
Source: RBI, Angel Research
Market Outlook
September 21, 2017
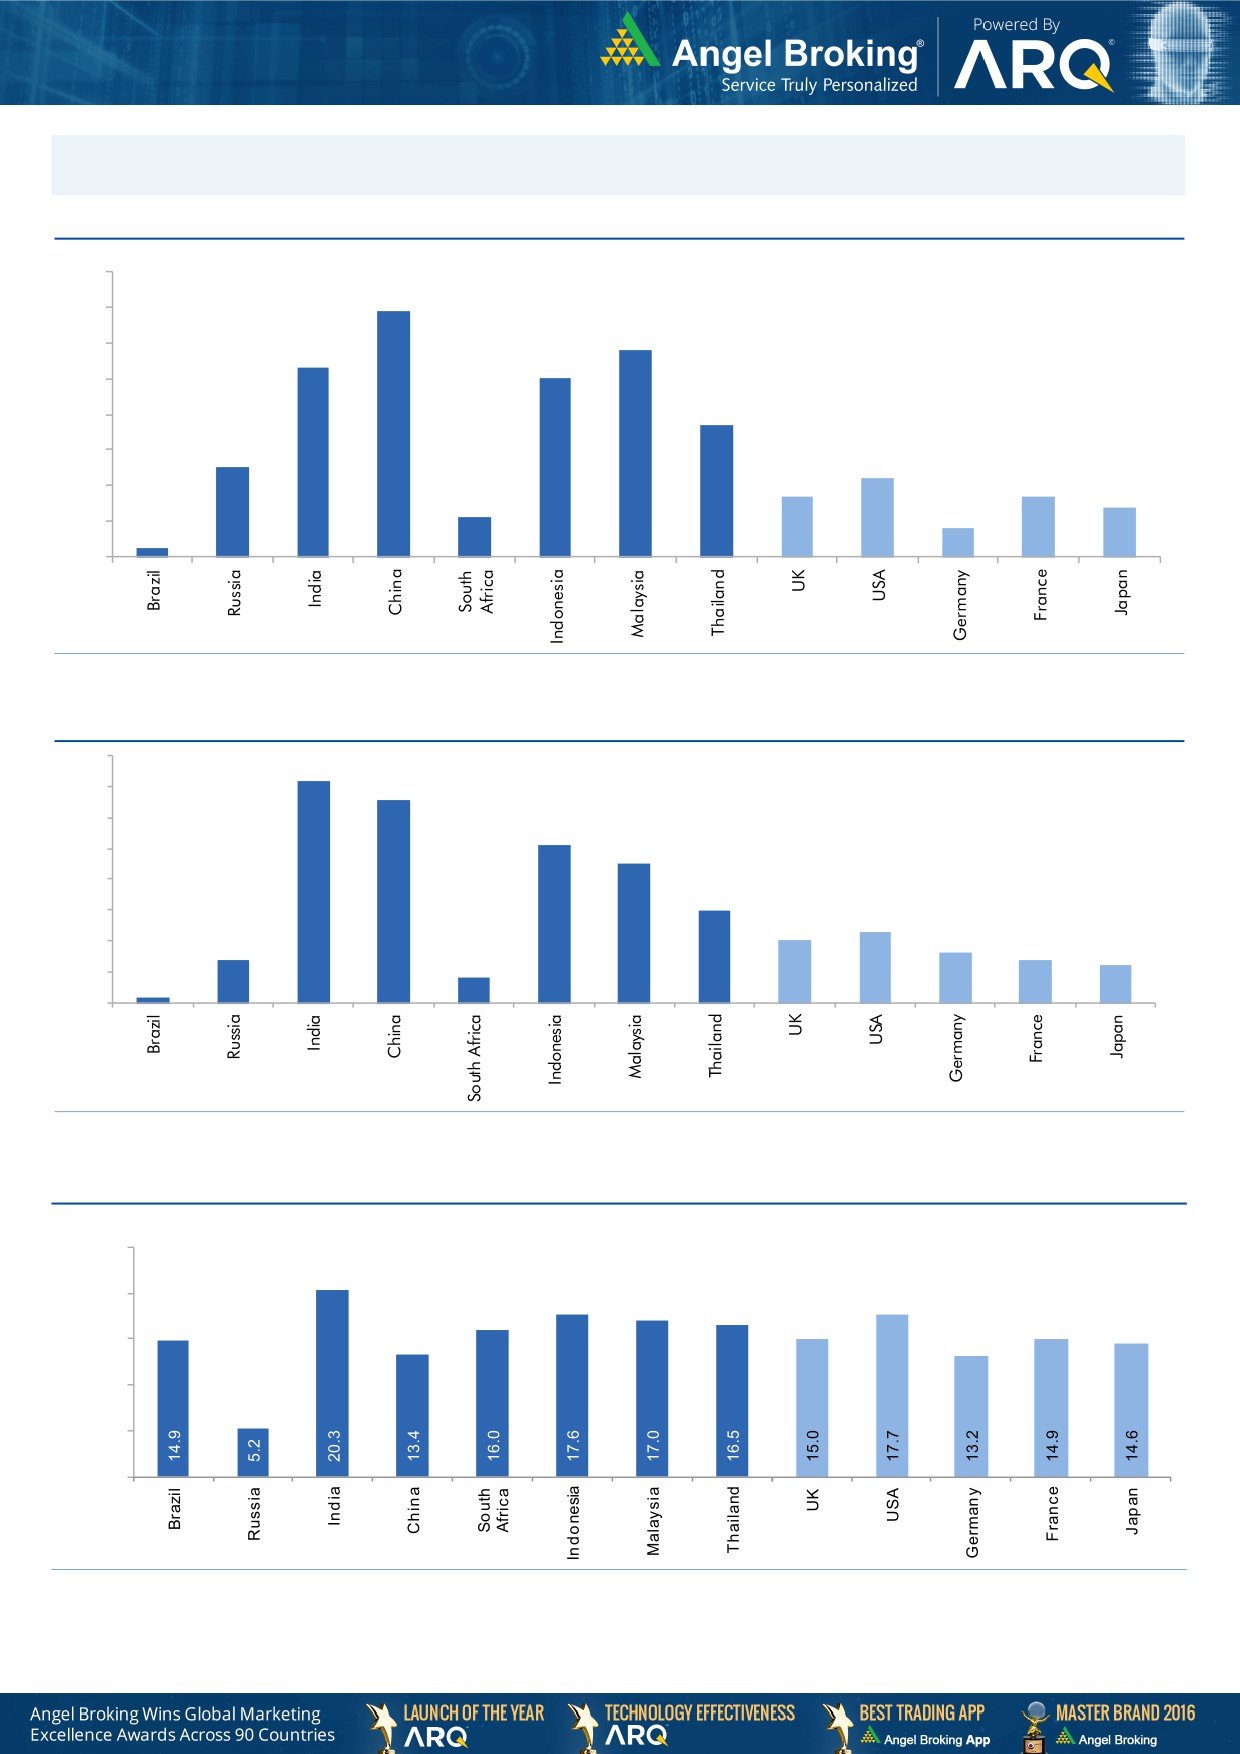
Global watch
Exhibit 1: Latest quarterly GDP Growth (%, yoy) across select developing and developed countries
(%)
8.0
6.9
7.0
5.8
6.0
5.3
5.0
5.0
1.1
3.7
4.0
2.5
3.0
2.2
1.7
1.7
2.0
1.4
0.8
1.0
0.3
-
Source: Bloomberg, Angel Research
Exhibit 2: 2017 GDP Growth projection by IMF (%, yoy) across select developing and developed countries
(%)
7.2
6.6
7.0
6.0
5.1
5.0
4.5
4.0
3.0
3.0
2.3
2.0
1.4
1.6
2.0
1.4
1.2
0.2
0.8
1.0
-
Source: IMF, Angel Research
Exhibit 3: One year forward P-E ratio across select developing and developed countries
(x)
25.0
20.0
15.0
10.0
5.0
-
Source: IMF, Angel Research
Market Outlook
September 21, 2017
Exhibit 4: Relative performance of indices across globe
Returns (%)
Country
Name of index
Closing price
1M
3M
1YR
Brazil
Bovespa
76,004
11.8
25.0
31.2
Russia
Micex
2,058
5.7
10.1
1.2
India
Nifty
10,141
3.1
5.0
15.5
China
Shanghai Composite
3,366
2.4
6.9
8.7
South Africa
Top 40
49,576
1.0
9.5
8.8
Mexico
Mexbol
50,364
(1.6)
2.6
7.1
Indonesia
LQ45
983
0.1
3.1
6.9
Malaysia
KLCI
1,774
(0.0)
(0.9)
5.2
Thailand
SET 50
1,073
7.3
7.7
15.2
USA
Dow Jones
22,413
2.9
3.9
23.4
UK
FTSE
7,272
(0.7)
(2.4)
5.2
Japan
Nikkei
20,310
4.3
1.2
21.8
Germany
DAX
12,569
4.0
(1.9)
20.8
France
CAC
5,242
3.0
(0.8)
18.2
Source: Bloomberg, Angel Research p68in4
Stock Watch
September 21, 2017
Company Name
Reco
CMP
Target
Mkt Cap
Sales ( Čcr )
OPM(%)
EPS (Č)
PER(x)
P/BV(x)
RoE(%)
EV/Sales(x)
(Č)
Price ( Č)
( Č cr )
FY18E FY19E
FY18E
FY19E
FY18E
FY19E
FY18E
FY19E
FY18E
FY19E
FY18E
FY19E
FY18E
FY19E
Agri / Agri Chemical
Rallis
Reduce
226
209
4,400
1,873
2,099
15.0
15.0
9.5
10.5
23.8
21.6
3.6
3.3
15.8
16.0
2.2
2.0
United Phosphorus
Neutral
832
-
42,256
18,922
21,949
18.0
18.5
36.2
45.6
23.0
18.2
4.8
4.0
22.7
23.8
2.4
2.0
Auto & Auto Ancillary
Ashok Leyland
Accumulate
119
127
34,914
23,339
27,240
10.1
10.8
4.7
6.2
25.7
19.2
5.1
4.5
20.0
23.6
1.5
1.2
Bajaj Auto
Neutral
3,088
-
89,359
23,936
27,955
19.5
20.1
142.7
167.3
21.6
18.5
4.7
4.2
21.8
22.8
3.3
2.8
Bharat Forge
Neutral
1,265
-
29,459
7,637
8,755
21.7
23.2
36.1
47.3
35.1
26.8
6.3
5.4
18.5
20.8
3.7
3.2
Eicher Motors
Neutral
32,444
-
88,319
19,043
22,837
19.5
19.9
835.4
1,019.0
38.8
31.8
14.5
11.2
40.9
37.8
4.5
3.7
Gabriel India
Neutral
214
-
3,075
1,782
2,033
9.7
10.2
7.1
8.9
30.2
24.2
6.1
5.2
21.0
22.2
1.7
1.4
Hero Motocorp
Accumulate
3,858
4,129
77,045
32,239
36,878
16.0
15.6
184.4
206.5
20.9
18.7
6.6
5.8
31.3
30.7
2.2
1.9
Jamna Auto Industries Neutral
273
-
2,175
1,441
1,662
14.4
14.8
13.9
17.6
19.6
15.5
5.4
4.3
30.0
31.0
1.5
1.3
Mahindra and Mahindra Neutral
1,293
-
80,298
46,971
53,816
13.6
14.0
67.7
79.8
19.1
16.2
2.7
2.4
15.0
15.9
1.6
1.3
Maruti
Accumulate
8,122
8,658
245,351
81,825
101,245
15.0
15.0
283.5
356.0
28.7
22.8
6.3
5.1
21.9
22.4
2.7
2.1
Minda Industries
Neutral
862
-
7,452
4,328
5,084
11.0
11.9
27.3
36.4
31.7
23.7
6.7
5.2
23.1
25.6
1.8
1.5
Motherson Sumi
Neutral
345
-
72,639
55,937
64,445
10.8
11.4
16.9
21.1
20.4
16.4
4.6
4.7
25.2
25.4
1.4
1.1
Tata Motors
Neutral
416
-
119,969
303,167
343,649
11.8
13.8
33.1
54.7
12.6
7.6
2.1
1.6
16.9
23.0
0.4
0.4
TVS Motor
Neutral
655
-
31,128
13,992
16,216
9.0
9.4
17.1
20.3
38.4
32.3
10.2
7.9
29.7
27.7
2.2
1.8
Amara Raja Batteries
Accumulate
780
858
13,316
6,140
7,122
14.3
15.6
29.3
39.0
26.6
20.0
4.5
3.8
17.1
19.0
2.2
1.9
Exide Industries
Neutral
222
-
18,896
8,689
9,854
15.1
15.2
9.7
11.0
23.0
20.2
4.1
3.6
15.7
16.1
1.9
1.7
Apollo Tyres
Neutral
262
-
13,349
15,739
17,326
13.3
14.6
20.4
26.7
12.9
9.8
1.6
1.4
20.4
26.7
1.1
1.0
Ceat
Neutral
1,767
-
7,149
6,661
7,717
11.1
14.2
116.2
178.2
15.2
9.9
2.6
2.2
15.2
21.3
1.2
1.0
JK Tyres
Neutral
158
-
3,576
8,318
9,239
16.2
16.4
21.0
27.5
7.5
5.7
1.5
1.2
19.1
20.4
0.9
0.8
Swaraj Engines
Neutral
2,037
-
2,530
788
889
16.4
16.5
71.6
81.0
28.5
25.2
8.2
7.6
29.6
31.0
2.9
2.5
Subros
Neutral
248
-
1,488
1,855
2,135
11.6
11.8
10.3
14.7
24.2
16.9
3.7
3.2
15.8
19.1
1.0
0.9
Capital Goods
BEML
Neutral
1,875
-
7,808
4,286
5,194
7.1
8.2
42.9
58.1
43.7
32.3
3.6
3.3
7.6
8.7
1.9
1.5
Bharat Electronics
Neutral
191
-
42,763
10,258
12,470
19.6
19.5
7.3
8.6
26.2
22.3
0.5
0.5
20.4
21.9
3.7
3.0
Voltas
Neutral
548
-
18,136
6,778
8,004
9.6
11.0
17.1
22.4
32.1
24.5
7.6
6.7
17.7
19.8
2.4
2.0
BHEL
Neutral
134
-
32,773
33,200
39,167
6.8
9.5
6.2
11.2
21.6
12.0
1.0
1.0
4.6
8.0
0.6
0.4
Blue Star
Accumulate
783
850
7,502
5,101
5,997
6.0
7.0
17.9
26.6
43.8
29.5
9.3
8.5
21.9
29.0
1.5
1.3
CG Power and Industrial
Neutral
81
-
5,086
6,555
7,292
7.5
7.5
-
0.8
8,115.0
101.4
1.3
1.3
0.1
1.2
0.9
0.8
Solutions
Greaves Cotton
Neutral
139
-
3,386
1,778
1,993
14.7
15.1
8.1
9.1
17.1
15.2
3.8
3.6
21.8
23.6
1.7
1.5
Stock Watch
September 21, 2017
Company Name
Reco
CMP
Target
Mkt Cap
Sales ( Čcr )
OPM(%)
EPS (Č)
PER(x)
P/BV(x)
RoE(%)
EV/Sales(x)
(Č)
Price ( Č)
( Č cr )
FY18E FY19E
FY18E
FY19E
FY18E
FY19E
FY18E
FY19E
FY18E
FY19E
FY18E
FY19E
FY18E
FY19E
Capital Goods
KEC International
Accumulate
316
350
8,111
9,779
11,113
9.4
9.8
14.2
18.2
22.2
17.3
4.3
3.5
21.1
22.1
1.1
1.0
KEI Industries
Accumulate
340
371
2,645
3,001
3,391
10.0
10.0
13.0
16.1
26.1
21.1
4.8
3.9
18.2
18.7
1.1
0.9
Thermax
Neutral
918
-
10,938
4,125
4,747
10.3
10.8
26.7
31.5
34.4
29.1
3.9
3.5
11.2
12.0
2.4
2.1
VATech Wabag
Accumulate
640
681
3,493
3,867
4,126
9.6
10.0
34.9
39.8
18.3
16.1
3.0
2.6
17.7
17.5
0.9
0.8
Cement
ACC
Neutral
1,788
-
33,567
12,255
13,350
13.5
14.3
58.0
66.2
30.8
27.0
3.7
3.4
11.5
12.2
2.7
2.5
Ambuja Cements
Neutral
280
-
55,618
10,250
11,450
17.5
19.0
7.2
8.3
38.9
33.8
2.8
2.6
7.0
7.8
5.2
4.6
India Cements
Neutral
185
-
5,705
6,135
6,750
14.8
15.2
8.5
11.5
21.8
16.1
1.1
1.0
4.8
6.2
1.3
1.1
JK Cement
Neutral
1,013
-
7,083
4,150
4,775
19.2
20.0
49.0
63.5
20.7
16.0
3.3
2.8
17.0
18.5
2.1
1.8
J K Lakshmi Cement
Neutral
418
-
4,922
3,422
3,757
15.5
17.0
13.5
23.2
31.0
18.0
3.2
2.8
10.8
15.5
1.8
1.6
Orient Cement
Neutral
165
-
3,378
2,215
3,233
16.8
17.0
5.9
6.9
28.0
23.9
2.1
2.0
10.8
10.1
2.5
1.7
UltraTech Cement
Neutral
4,197
-
115,220
28,250
35,150
20.2
23.5
77.5
122.2
54.2
34.3
4.6
4.1
9.6
14.8
4.5
3.6
Construction
KNR Constructions
Neutral
214
-
3,004
1,846
2,203
14.5
14.5
12.1
13.7
17.7
15.7
1.0
0.8
17.5
16.7
1.7
1.4
Larsen & Toubro
Neutral
1,235
-
172,995
95,787
109,476
10.2
11.6
44.5
50.8
27.8
24.3
3.5
3.2
12.9
13.1
2.4
2.1
Gujarat Pipavav Port
Neutral
144
-
6,952
739
842
61.6
62.7
5.1
6.2
28.2
23.4
3.5
3.4
12.7
14.9
8.9
7.7
PNC Infratech
Accumulate
133
143
3,422
2,040
2,935
13.0
13.0
6.4
9.0
20.8
14.8
0.5
0.5
9.7
12.2
1.7
1.2
Simplex Infra
Neutral
479
-
2,367
6,012
6,619
11.6
11.7
21.1
31.0
22.7
15.5
1.6
1.5
6.5
8.6
0.9
0.8
Sadbhav Engineering
Neutral
290
-
4,968
3,823
4,426
10.7
10.8
10.3
11.8
28.1
24.5
3.4
3.0
10.1
10.5
1.6
1.4
NBCC
Neutral
220
-
19,827
9,099
12,706
6.4
6.4
7.3
9.6
30.3
23.0
1.3
1.1
27.5
30.5
2.0
1.5
MEP Infra
Neutral
112
-
1,828
2,403
2,910
18.3
16.8
2.4
6.1
47.8
18.5
18.1
12.2
35.2
55.8
1.9
1.6
SIPL
Neutral
96
-
3,376
2,060
2,390
46.8
47.7
(5.8)
(3.1)
3.6
4.1
(14.2)
(2.3)
6.4
6.0
Engineers India
Neutral
157
-
10,580
1,795
2,611
21.1
22.4
5.9
8.1
26.6
19.4
1.9
1.8
12.9
16.1
4.3
2.8
Financials
Axis Bank
Accumulate
519
580
124,519
32,558
35,843
3.5
3.2
27.8
41.0
18.7
12.7
2.0
1.8
11.4
14.9
-
-
Bank of Baroda
Neutral
148
-
34,194
22,533
26,079
2.4
2.4
12.0
20.9
12.4
7.1
0.8
0.8
6.6
11.0
-
-
Canara Bank
Neutral
345
-
20,618
17,925
20,235
2.0
2.1
18.5
36.5
18.7
9.5
0.7
0.7
3.4
6.2
-
-
Can Fin Homes
Neutral
2,828
-
7,528
586
741
3.5
3.5
107.8
141.0
26.2
20.1
5.8
4.7
24.1
25.6
-
-
Cholamandalam Inv. &
Neutral
1,173
-
18,334
2,826
3,307
6.3
6.3
53.7
64.6
21.9
18.2
3.7
3.2
18.3
18.9
-
-
Fin. Co.
Dewan Housing Finance Neutral
591
-
18,523
2,676
3,383
2.4
2.7
37.4
49.7
15.8
11.9
2.1
1.8
13.8
16.2
-
-
Equitas Holdings
Buy
162
235
5,489
1,125
1,380
9.6
9.8
1.5
6.0
108.0
27.0
2.5
2.3
2.4
8.2
-
-
Federal Bank
Neutral
120
-
23,425
4,896
5,930
2.8
3.1
5.4
7.6
22.4
15.9
1.9
1.8
8.5
11.0
-
-
Stock Watch
September 21, 2017
Company Name
Reco
CMP
Target
Mkt Cap
Sales ( Čcr )
OPM(%)
EPS (Č)
PER(x)
P/BV(x)
RoE(%)
EV/Sales(x)
(Č)
Price ( Č)
( Č cr )
FY18E FY19E
FY18E
FY19E
FY18E
FY19E
FY18E
FY19E
FY18E
FY19E
FY18E
FY19E
FY18E
FY19E
Financials
GIC Housing
Buy
536
655
2,886
376
477
3.6
3.7
33.0
40.0
16.2
13.4
2.9
2.5
20.0
23.0
-
-
HDFC Bank
Neutral
1,849
-
477,338
55,236
63,253
4.5
4.4
68.9
82.4
26.9
22.4
4.7
3.9
18.7
18.5
-
-
ICICI Bank
Accumulate
291
315
186,581
42,361
51,378
3.6
3.9
18.4
25.7
15.8
11.3
1.7
1.7
11.3
15.0
-
-
Karur Vysya Bank
Accumulate
159
180
9,612
3,289
3,630
3.7
3.9
10.8
14.1
14.7
11.3
1.8
1.6
12.5
14.7
-
-
LIC Housing Finance
Neutral
649
-
32,737
4,895
6,332
3.4
3.7
50.7
66.8
12.8
9.7
2.6
2.1
21.7
23.8
-
-
Punjab Natl.Bank
Neutral
145
-
30,941
23,708
25,758
2.1
2.1
5.9
16.4
24.7
8.9
0.7
0.7
3.0
8.3
-
-
RBL Bank
Neutral
531
-
21,931
2,309
2,888
2.6
2.5
16.4
19.1
32.5
27.8
4.1
3.6
13.3
13.8
-
-
Repco Home Finance
Buy
648
825
4,051
496
597
4.4
4.2
38.5
48.7
16.8
13.3
3.0
2.5
19.6
20.6
-
-
South Ind.Bank
Neutral
32
-
5,693
3,195
3,567
3.0
3.1
3.0
3.8
10.5
8.2
1.0
0.9
10.5
11.9
-
-
St Bk of India
Neutral
271
-
233,540
105,827
121,056
2.4
2.5
16.1
25.6
16.8
10.6
1.3
1.2
6.6
9.9
-
-
Union Bank
Neutral
139
-
10,101
14,650
16,225
2.3
2.3
23.1
32.5
6.0
4.3
0.5
0.4
7.1
9.2
-
-
Yes Bank
Neutral
1,879
-
86,043
11,088
13,138
3.0
2.9
84.0
99.3
22.4
18.9
3.4
3.0
16.3
16.8
-
-
FMCG
Akzo Nobel India
Neutral
1,887
-
9,052
3,164
3,607
13.8
13.7
58.6
67.9
32.2
27.8
7.9
7.0
24.5
25.1
2.7
2.4
Asian Paints
Neutral
1,239
-
118,821
17,603
20,615
18.6
18.6
2,128.9
2,543.3
0.6
0.5
12.3
10.3
28.0
28.9
6.5
5.5
Britannia
Neutral
4,349
-
52,210
9,690
11,278
14.8
15.4
84.0
101.0
51.8
43.1
18.9
15.0
40.6
39.0
5.4
4.6
Colgate
Neutral
1,136
-
30,896
4,420
5,074
24.9
25.3
28.6
32.8
39.7
34.6
15.7
12.7
43.8
40.5
6.7
5.8
Dabur India
Neutral
315
-
55,426
8,346
9,344
19.6
19.9
7.8
9.0
40.3
35.0
8.1
7.4
25.2
24.8
6.2
5.5
GlaxoSmith Con*
Neutral
5,025
-
21,135
5,072
5,760
18.2
18.4
176.3
199.2
28.5
25.2
6.1
5.5
21.2
21.7
3.5
3.0
Godrej Consumer
Neutral
948
-
64,566
10,171
11,682
20.8
21.5
21.7
27.1
43.7
35.0
9.8
8.4
22.3
23.4
6.5
5.6
HUL
Neutral
1,259
-
272,443
37,077
41,508
20.3
21.8
5,189.9
6,318.5
0.2
0.2
38.4
32.8
74.8
82.0
7.2
6.4
ITC
Neutral
271
-
330,330
44,588
49,853
37.0
37.3
9.6
11.0
28.3
24.7
6.9
6.6
25.1
27.3
6.9
6.1
Marico
Neutral
331
-
42,682
6,788
7,766
18.5
19.2
7.1
8.5
46.6
38.9
16.3
14.0
36.9
38.0
6.1
5.3
Nestle*
Neutral
7,223
-
69,641
10,083
11,182
20.0
20.9
119.7
141.3
60.3
51.1
212.7
194.4
36.7
39.8
6.6
5.9
Tata Global
Neutral
214
-
13,487
7,121
7,641
11.9
12.3
6.9
8.0
31.0
26.7
2.1
2.0
6.8
7.2
1.7
1.6
Procter & Gamble
Neutral
8,418
-
27,325
3,034
3,579
27.1
27.7
167.7
198.8
50.2
42.3
13.5
11.6
28.8
29.5
8.4
7.1
Hygiene
IT
HCL Tech^
Accumulate
887
1,014
126,531
52,342
57,053
20.9
20.9
62.8
67.6
14.1
13.1
3.2
2.7
22.4
20.6
2.1
1.8
Infosys
Buy
912
1,179
209,483
73,963
80,619
26.0
26.0
64.4
69.3
14.2
13.2
2.8
2.6
19.7
19.6
2.3
2.0
TCS
Accumulate
2,492
2,651
491,109
127,403
138,870
27.6
27.6
144.5
156.0
17.3
16.0
5.1
4.8
29.7
29.8
3.5
3.2
Tech Mahindra
Buy
449
533
43,764
31,015
33,496
15.0
15.0
35.6
38.1
12.6
11.8
2.1
2.0
17.0
16.3
1.2
1.0
Stock Watch
September 21, 2017
Company Name
Reco
CMP
Target
Mkt Cap
Sales ( Čcr )
OPM(%)
EPS (Č)
PER(x)
P/BV(x)
RoE(%)
EV/Sales(x)
(Č)
Price ( Č)
( Č cr )
FY18E FY19E
FY18E
FY19E
FY18E
FY19E
FY18E
FY19E
FY18E
FY19E
FY18E
FY19E
FY18E
FY19E
IT
Wipro
Neutral
292
-
141,986
58,536
61,858
20.3
20.3
18.2
19.1
16.0
15.3
2.5
2.2
14.6
13.4
2.4
2.2
Media
D B Corp
Neutral
368
-
6,775
2,404
2,625
30.5
31.5
23.7
26.9
15.5
13.7
3.7
3.1
23.5
22.8
2.7
2.4
HT Media
Neutral
104
-
2,414
2,589
2,830
15.1
15.4
8.3
10.9
12.5
9.5
1.0
0.9
8.4
10.4
0.5
0.3
Jagran Prakashan
Buy
182
225
5,950
2,541
2,835
28.5
28.7
12.7
14.1
14.3
12.9
3.0
2.6
21.3
21.4
2.2
1.9
Sun TV Network
Neutral
842
-
33,196
3,238
3,789
51.9
55.1
30.9
38.0
27.3
22.2
7.8
6.8
30.0
31.0
9.8
8.2
Hindustan Media
Neutral
272
-
1,994
1,002
1,074
23.3
23.5
29.2
33.8
9.3
8.0
1.5
1.2
15.6
15.4
1.0
0.7
Ventures
TV Today Network
Accumulate
337
380
2,012
667
727
27.7
27.7
18.6
20.1
18.1
16.8
2.8
2.9
15.6
17.3
2.5
2.4
Music Broadcast Limited Accumulate
391
434
2,229
271
317
91.0
109.0
6.0
10.0
65.1
39.1
4.1
3.7
6.5
9.3
7.8
6.4
Metals & Mining
Coal India
Neutral
256
-
159,158
82,301
91,235
17.0
18.0
17.1
20.5
15.0
12.5
2.8
2.6
45.0
55.0
1.6
1.4
Hind. Zinc
Neutral
305
-
128,767
22,108
24,555
57.0
58.0
22.1
26.3
13.8
11.6
4.5
3.6
32.0
35.0
4.8
4.0
Hindalco
Neutral
245
-
54,924
102,350
105,355
13.5
14.5
21.5
24.5
11.4
10.0
1.6
1.3
15.0
15.2
1.1
1.1
JSW Steel
Neutral
259
-
62,654
64,500
68,245
21.1
21.5
20.1
21.2
12.9
12.2
2.4
2.0
-
-
1.7
1.6
NMDC
Neutral
131
-
41,431
10,209
11,450
47.0
48.0
11.1
12.1
11.8
10.8
1.6
1.5
-
-
3.6
3.2
SAIL
Neutral
62
-
25,792
54,100
63,555
3.0
10.0
(10.0)
1.5
41.6
0.8
0.8
-
-
1.5
1.3
Vedanta
Neutral
323
-
120,158
81,206
87,345
28.0
29.0
26.5
33.5
12.2
9.7
2.8
2.4
-
-
2.2
1.9
Tata Steel
Neutral
688
-
66,786
121,445
126,500
16.2
17.2
65.4
81.3
10.5
8.5
1.7
1.4
-
-
1.1
0.9
Oil & Gas
GAIL
Neutral
417
-
70,502
53,115
52,344
14.2
15.3
30.0
31.1
13.9
13.4
1.7
1.6
-
-
1.1
1.0
ONGC
Neutral
168
-
215,021
83,111
84,934
44.2
44.9
16.4
16.9
10.2
9.9
1.2
1.2
-
-
2.5
2.4
Indian Oil Corp
Neutral
414
-
201,010
396,116
432,560
8.5
8.8
40.1
42.2
10.3
9.8
1.8
1.6
-
-
0.7
0.6
Reliance Industries
Neutral
847
-
550,937
257,711
267,438
17.0
18.2
89.1
89.5
9.5
9.5
0.9
0.8
-
-
1.8
1.7
Pharmaceuticals
Alembic Pharma
Buy
479
600
9,036
3,903
4,584
18.2
19.2
21.8
27.2
22.0
17.6
4.0
3.3
19.8
20.6
2.3
2.0
Alkem Laboratories Ltd
Buy
1,753
2,161
20,960
6,901
7,850
18.4
19.1
85.0
100.5
20.6
17.4
4.2
3.5
20.2
20.1
3.0
2.6
Aurobindo Pharma
Accumulate
746
823
43,698
17,086
19,478
22.1
22.0
44.7
51.4
16.7
14.5
3.7
3.0
24.7
22.7
2.7
2.3
Aventis*
Neutral
4,085
-
9,408
2,508
2,862
16.8
16.8
139.9
153.8
29.2
26.6
4.2
3.4
23.5
25.8
3.4
2.8
Cadila Healthcare
Reduce
487
426
49,810
11,584
13,228
20.3
20.4
18.7
21.3
26.0
22.8
5.8
4.8
24.6
22.9
4.1
3.6
Cipla
Sell
569
458
45,746
16,619
19,437
15.4
16.2
19.7
24.3
28.9
23.4
3.3
2.9
12.0
13.2
2.9
2.5
Dr Reddy's
Neutral
2,314
-
38,358
15,844
17,973
17.6
18.2
91.7
111.0
25.2
20.8
2.9
2.6
11.9
13.0
2.6
2.3
GSK Pharma*
Neutral
2,388
-
20,224
3,260
3,651
15.0
18.0
46.1
58.6
51.8
40.7
10.6
11.0
20.0
26.5
6.1
5.6
Indoco Remedies
Sell
204
153
1,877
1,154
1,310
14.9
14.9
11.3
12.7
18.0
16.0
2.6
2.3
15.0
15.0
1.8
1.5
Stock Watch
September 21, 2017
Company Name
Reco
CMP
Target
Mkt Cap
Sales ( Čcr )
OPM(%)
EPS (Č)
PER(x)
P/BV(x)
RoE(%)
EV/Sales(x)
(Č)
Price ( Č)
( Č cr )
FY18E FY19E
FY18E
FY19E
FY18E
FY19E
FY18E
FY19E
FY18E
FY19E
FY18E
FY19E
FY18E
FY19E
Pharmaceuticals
Ipca labs
Accumulate
492
540
6,203
3,593
4,022
14.5
15.5
19.4
25.2
25.3
19.5
2.3
2.1
9.5
11.2
1.8
1.6
Lupin
Buy
1,002
1,467
45,279
18,657
21,289
21.3
23.3
52.8
66.7
19.0
15.0
2.9
2.4
16.3
17.5
2.4
2.0
Natco Pharma
Neutral
795
-
13,852
1,836
1,946
31.8
28.9
22.1
20.6
35.9
38.5
7.2
6.4
20.1
16.7
7.4
7.0
Sun Pharma
Accumulate
506
558
121,510
32,899
36,451
26.9
25.4
31.6
32.3
16.0
15.7
2.8
2.5
18.7
18.8
3.3
2.8
Syngene International
Buy
474
557
9,489
1,402
1,823
32.8
36.0
15.9
20.7
29.9
23.0
5.6
4.6
18.7
20.0
6.7
5.2
Power
Tata Power
Neutral
84
-
22,720
32,547
33,806
20.5
20.5
4.7
5.4
17.9
15.7
1.7
1.5
10.5
10.5
1.7
1.6
NTPC
Neutral
167
-
138,070
86,070
101,246
28.3
30.7
12.9
16.2
13.0
10.3
1.3
1.2
10.6
12.4
3.0
2.7
Power Grid
Neutral
213
-
111,354
29,183
32,946
89.7
90.0
18.0
20.8
11.9
10.2
2.0
1.8
17.7
18.2
7.8
7.2
Real Estate
Prestige Estate
Neutral
271
-
10,172
4,607
5,146
21.0
22.2
7.9
9.8
34.3
27.7
2.1
2.0
10.3
12.0
3.4
3.1
MLIFE
Neutral
518
-
2,659
487
590
12.3
17.8
21.0
31.2
24.7
16.6
1.3
1.2
5.2
7.4
4.2
3.4
Telecom
Bharti Airtel
Neutral
396
-
158,397
97,903
105,233
36.0
36.3
9.3
11.1
42.6
35.9
2.1
1.9
5.0
5.6
2.6
2.3
Idea Cellular
Neutral
80
-
28,909
35,012
37,689
27.1
27.7
(4.4)
(2.7)
1.3
1.3
(6.8)
(4.6)
2.1
1.9
zOthers
Abbott India
Neutral
4,238
-
9,004
3,244
3,723
14.9
16.1
167.5
209.4
25.3
20.2
5.6
4.7
23.7
24.8
2.4
2.0
Asian Granito
Accumulate
504
570
1,515
1,169
1,286
12.5
12.5
16.0
19.7
31.5
25.5
3.4
3.0
10.7
11.6
1.5
1.4
Bajaj Electricals
Neutral
383
-
3,892
4,646
5,301
6.7
7.6
16.1
22.3
23.8
17.2
3.9
3.3
16.4
19.2
0.8
0.7
Banco Products (India)
Neutral
223
-
1,595
1,530
1,695
13.2
12.7
19.0
20.0
11.7
11.2
1.9
1.7
0.2
0.2
1.0
105.9
Coffee Day Enterprises
Neutral
241
-
4,969
3,494
3,913
17.4
18.0
4.8
5.7
-
42.3
2.1
2.0
-
0.1
1.9
1.7
Ltd
Elecon Engineering
Neutral
58
-
649
171
201
15.0
16.2
36.0
43.0
1.6
1.3
0.1
0.1
0.1
0.1
3.2
2.7
Garware Wall Ropes
Neutral
865
-
1,893
928
1,003
15.2
15.2
39.4
43.2
21.9
20.0
3.6
3.1
16.5
15.4
1.9
1.7
Goodyear India*
Neutral
849
-
1,958
1,717
1,866
11.8
12.3
47.9
49.8
17.7
17.1
2.7
2.4
15.6
15.7
0.9
119.7
Hitachi
Neutral
1,972
-
5,363
2,355
2,715
10.3
10.8
49.0
60.9
40.3
32.4
9.4
7.5
0.2
0.2
2.3
2.0
HSIL
Neutral
392
-
2,832
2,240
2,670
14.6
15.0
17.0
22.0
23.0
17.8
1.9
1.8
0.1
0.1
1.5
1.2
Interglobe Aviation
Neutral
1,132
-
40,937
22,570
27,955
14.2
15.0
63.6
81.8
17.8
13.9
9.4
7.9
0.5
0.6
1.5
1.1
Jyothy Laboratories
Neutral
414
-
7,530
1,781
2,044
14.1
15.0
9.4
10.5
44.3
39.5
9.4
8.9
0.2
0.2
4.4
3.8
Linc Pen & Plastics
Neutral
232
-
343
420
462
9.3
9.3
15.3
17.1
15.2
13.6
2.6
2.7
16.9
19.5
0.9
0.8
M M Forgings
Neutral
660
-
797
542
642
20.1
21.0
41.6
56.8
15.9
11.6
2.2
1.9
0.1
0.2
1.9
1.7
Mirza International
Neutral
165
-
1,981
1,148
1,285
18.0
18.0
8.0
9.4
20.5
17.6
3.4
2.9
16.3
16.1
1.9
1.6
Navkar Corporation
Buy
193
265
2,759
561
617
41.5
41.5
11.5
12.7
16.8
15.2
1.8
1.6
10.5
10.4
5.6
4.9
Nilkamal
Neutral
1,579
-
2,356
2,317
2,525
11.4
11.1
96.0
105.0
16.5
15.0
2.8
2.4
0.2
0.2
1.0
0.9
Stock Watch
September 21, 2017
Company Name
Reco
CMP
Target Mkt Cap
Sales ( Čcr )
OPM(%)
EPS (Č)
PER(x)
P/BV(x)
RoE(%)
EV/Sales(x)
(Č)
Price ( Č)
( Č cr )
FY18E FY19E FY18E FY19E FY18E FY19E FY18E FY19E FY18E FY19E FY18E FY19E FY18E FY19E
zOthers
Parag Milk Foods
Neutral
244
-
2,051
1,987
2,379
7.6
9.0
12.4
18.3
19.7
13.3
2.8
2.4
8.2
13.2
1.1
1.0
Radico Khaitan
Neutral
168
-
2,241
1,811
1,992
13.2
13.2
8.1
8.8
20.8
19.1
2.1
2.3
10.1
12.0
1.6
1.4
Relaxo Footwears
Neutral
520
-
6,247
1,981
2,310
13.7
14.5
12.0
15.5
43.3
33.6
8.4
6.8
0.2
0.2
3.2
2.8
Siyaram Silk Mills
Accumulate
2,307
2,500
2,163
1,769
1,981
12.7
12.7
113.1
131.1
20.4
17.6
3.2
2.7
15.5
15.5
1.4
1.2
Styrolution ABS India* Neutral
920
-
1,618
1,800
1,980
8.0
8.1
42.0
46.2
21.9
19.9
2.5
2.2
0.1
0.1
1.0
0.9
Surya Roshni
Neutral
319
-
1,398
4,870
5,320
7.7
7.8
22.8
28.1
14.0
11.4
1.9
1.6
0.1
0.1
0.5
0.4
TVS Srichakra
Neutral
3,215
-
2,461
2,729
2,893
12.7
12.5
248.5
265.0
12.9
12.1
3.7
3.0
0.3
0.3
0.9
0.8
Visaka Industries
Neutral
645
-
1,024
1,104
1,214
12.1
12.6
31.0
37.9
20.8
17.0
2.5
2.3
0.1
0.1
1.2
1.0
VIP Industries
Buy
248
300
3,510
1,450
1,693
10.4
10.5
6.5
7.8
38.0
31.8
8.0
7.0
21.1
22.1
2.4
2.1
Navin Fluorine
Accumulate
653
730
3,217
945
1,154
22.4
22.6
28.7
34.8
22.8
18.8
3.8
3.2
-
-
2.9
2.3
Source: Company, Angel Research; Note: *December year end; #September year end; &October year end; Price as on September 20, 2017
Market Outlook
September 21, 2017
Research Team Tel: 022 - 39357800
DISCLAIMER
Angel Broking Private Limited (hereinafter referred to as “Angel”) is a registered Member of National Stock Exchange of India
Limited,Bombay Stock Exchange Limited and Metropolitan Stock Exchange Limited. It is also registered as a Depository Participant with
CDSL and Portfolio Manager with SEBI. It also has registration with AMFI as a Mutual Fund Distributor. Angel Broking Private Limited is a
registered entity with SEBI for Research Analyst in terms of SEBI (Research Analyst) Regulations, 2014 vide registration number
INH000000164. Angel or its associates has not been debarred/ suspended by SEBI or any other regulatory authority for accessing
/dealing in securities Market. Angel or its associates/analyst has not received any compensation / managed or
co-managed public offering of securities of the company covered by Analyst during the past twelve months.
This document is solely for the personal information of the recipient, and must not be singularly used as the basis of any investment
decision. Nothing in this document should be construed as investment or financial advice. Each recipient of this document should make
such investigations as they deem necessary to arrive at an independent evaluation of an investment in the securities of the companies
referred to in this document (including the merits and risks involved), and should consult their own advisors to determine the merits and
risks of such an investment.
Reports based on technical and derivative analysis center on studying charts of a stock's price movement, outstanding positions and
trading volume, as opposed to focusing on a company's fundamentals and, as such, may not match with a report on a company's
fundamentals. Investors are advised to refer the Fundamental and Technical Research Reports available on our website to evaluate the
contrary view, if any.
The information in this document has been printed on the basis of publicly available information, internal data and other reliable
sources believed to be true, but we do not represent that it is accurate or complete and it should not be relied on as such, as this
document is for general guidance only. Angel Broking Pvt. Limited or any of its affiliates/ group companies shall not be in any way
responsible for any loss or damage that may arise to any person from any inadvertent error in the information contained in this report.
Angel Broking Pvt. Limited has not independently verified all the information contained within this document. Accordingly, we cannot
testify, nor make any representation or warranty, express or implied, to the accuracy, contents or data contained within this document.
While Angel Broking Pvt. Limited endeavors to update on a reasonable basis the information discussed in this material, there may be
regulatory, compliance, or other reasons that prevent us from doing so.
This document is being supplied to you solely for your information, and its contents, information or data may not be reproduced,
redistributed or passed on, directly or indirectly.
Neither Angel Broking Pvt. Limited, nor its directors, employees or affiliates shall be liable for any loss or damage that may arise from
or in connection with the use of this information.